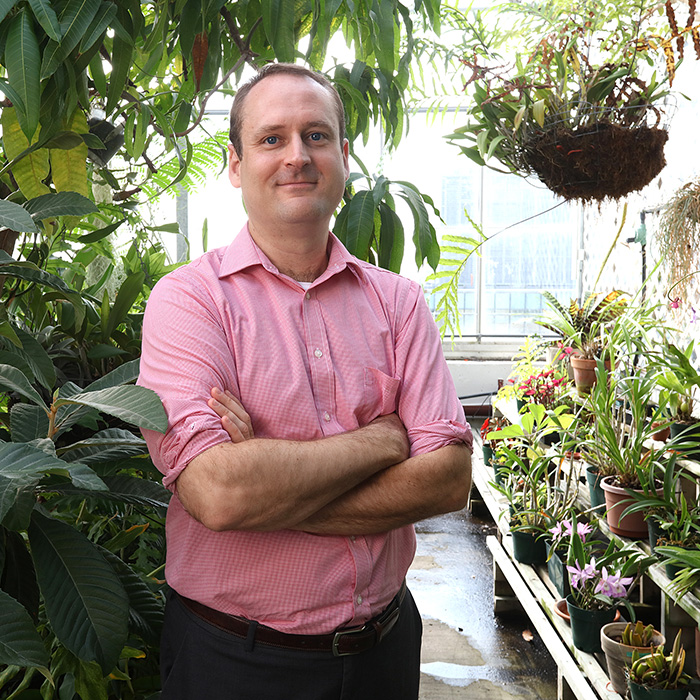
Dr. Robert I. Colautti
Associate Professor of Biology
 quantitative.bio
Welcome to the CSEE 2026 Workshop — an AZ2CH R crash course in reproducible analysis of ecological communities.
Over the next three hours we learn R fundamentals → data wrangling → publication-quality visualizations → multivariate statistics — all through a worked microbiome metabarcoding analysis on a real tick microbiome dataset.
| Time | Block | Topic | Presenter |
|---|---|---|---|
| 1:00 – 1:10 | — | Workshop overview | |
| 1:10 – 1:20 | I | R basics review | Dr. María José Gómez Quijano |
| 1:20 – 1:40 | I | Data science / dplyr review | Dr. María José Gómez Quijano |
| 1:40 – 2:00 | II | Grammar of Graphics review (ggplot2) | Charlotte Ngo |
| 2:00 – 2:20 | III | Ordination & multivariate methods (lecture) | Dr. Robert I. Colautti |
| 2:20 – 2:30 | — | Coffee break (10 min) | |
| 2:30 – 2:50 | III | From samples to a community matrix | Dr. Robert I. Colautti |
| 2:50 – 3:05 | III | Single vs repeated subsampling | Sreevatshan K. Srinivasan |
| 3:05 – 3:20 | III | α-diversity analysis | Sreevatshan K. Srinivasan |
| 3:20 – 3:50 | III | β-diversity analysis | Sreevatshan K. Srinivasan |
| 3:50 – 4:00 | — | Wrap-up, Q&A, resources |
otu_table.csv — ASV abundance table (41 tick samples × 2,059 ASVs)taxonomy_table.csv — taxonomic assignments per ASV (kingdom → species)sample_metadata.tsv — per-sample metadata (location, tissue type, Stock_Conc, total_reads, …)Three parts, taught in sequence with one coffee break. The same tick microbiome dataset threads through Parts II and III, so the visual literacy you build in Part II carries directly into the metabarcoding analysis in Part III.
R basics, R Markdown, and data wrangling with the tidyverse / dplyr. Students who already know R can use this block as a quick refresher; students new to R get the workflow they'll need for Parts II and III.
Topics: install R/RStudio, IDE tour, R Markdown setup, YAML, code chunks, equations, packages, help; objects, vectors, sequences, data frames, subsetting, opening CSVs, data types; the pipe operator, filter(), select(), arrange(), mutate(), missing data, summary statistics, joining/merging, pivoting.
Base R graphics, then a deeper dive into ggplot2 and the Grammar of Graphics. Customization (color, shape, themes), histograms, boxplots, and regression overlays — using the same tick microbiome dataset that Part III analyzes.
Topics: why R for graphing; accessibility and color choices; base R quick plots, axis labels, point color and size; ggplot2 layers, aesthetics, titles/labels, color, shape, themes; histograms and boxplots; regression lines.
End-to-end worked example: a 16S rRNA microbiome dataset from the blacklegged tick Ixodes scapularis (Paulson et al. 2023). Students go from raw OTU/ASV tables → QC/filtering → rarefaction → α-diversity (Richness, Evenness, Shannon, Simpson) → β-diversity (Jaccard, Bray–Curtis, NMDS, neighbor-joining trees with ggtree).
Topics: library setup (tidyverse, vegan, ape, ggtree); OTU/taxonomy/metadata input; chloroplast filtering, sequencing-error QC, read-depth filtering; location-label cleanup, rarefaction curves, single-subsampling; α-diversity by tissue type and by location; β-diversity with Jaccard and Bray–Curtis distance + neighbor-joining trees (ggtree); NMDS ordination.
Reproducible sample tracking: before any of this, samples need to be tracked end-to-end — that's what BaRcodeR is for (free, from this lab).
Three hours, no prior coding required. By the end of the workshop we’ll all have:
Please install R and RStudio Desktop before the workshop. Then in RStudio, run:
install.packages(c("tidyverse", "vegan", "ape", "here", "rmarkdown", "knitr"))
# ggtree is on Bioconductor:
if (!requireNamespace("BiocManager", quietly = TRUE)) install.packages("BiocManager")
BiocManager::install("ggtree")
Also download the .zip files (See 'Download CSEE2026 files' button) — the student workbook with empty code chunks you'll fill in as we go.
If the install hits a snag, that's fine — we'll troubleshoot in the first 15 minutes. Bring your laptop, a charger, and a willingness to make messy mistakes. (You'll make several. That's the point.)
You've never opened R before, or you've opened it twice and bounced off. You're a graduate student, postdoc, or working biologist who knows the science but feels stuck whenever the analysis turns into code. Or you're an instructor curious about evidence-based teaching of computational fluency to non-CS learners. Welcome.
The instructors leading today's workshop, plus the content developer who helped build it. Full lab membership at EcoEvoGeno.org/people.html.
Associate Professor of Biology
PhD Student
PhD Candidate
PhD Candidate
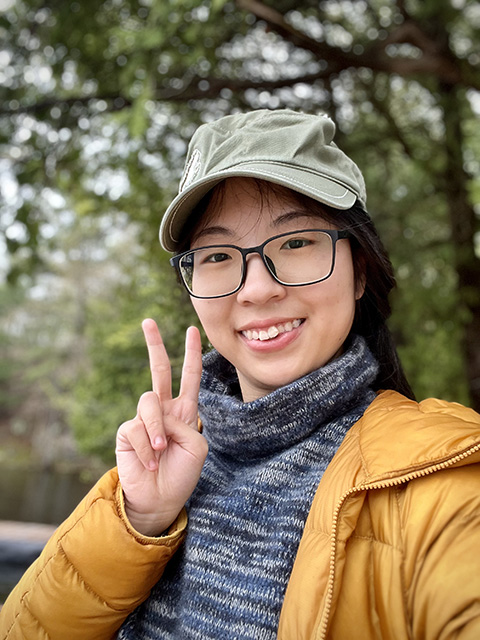
MSc Student